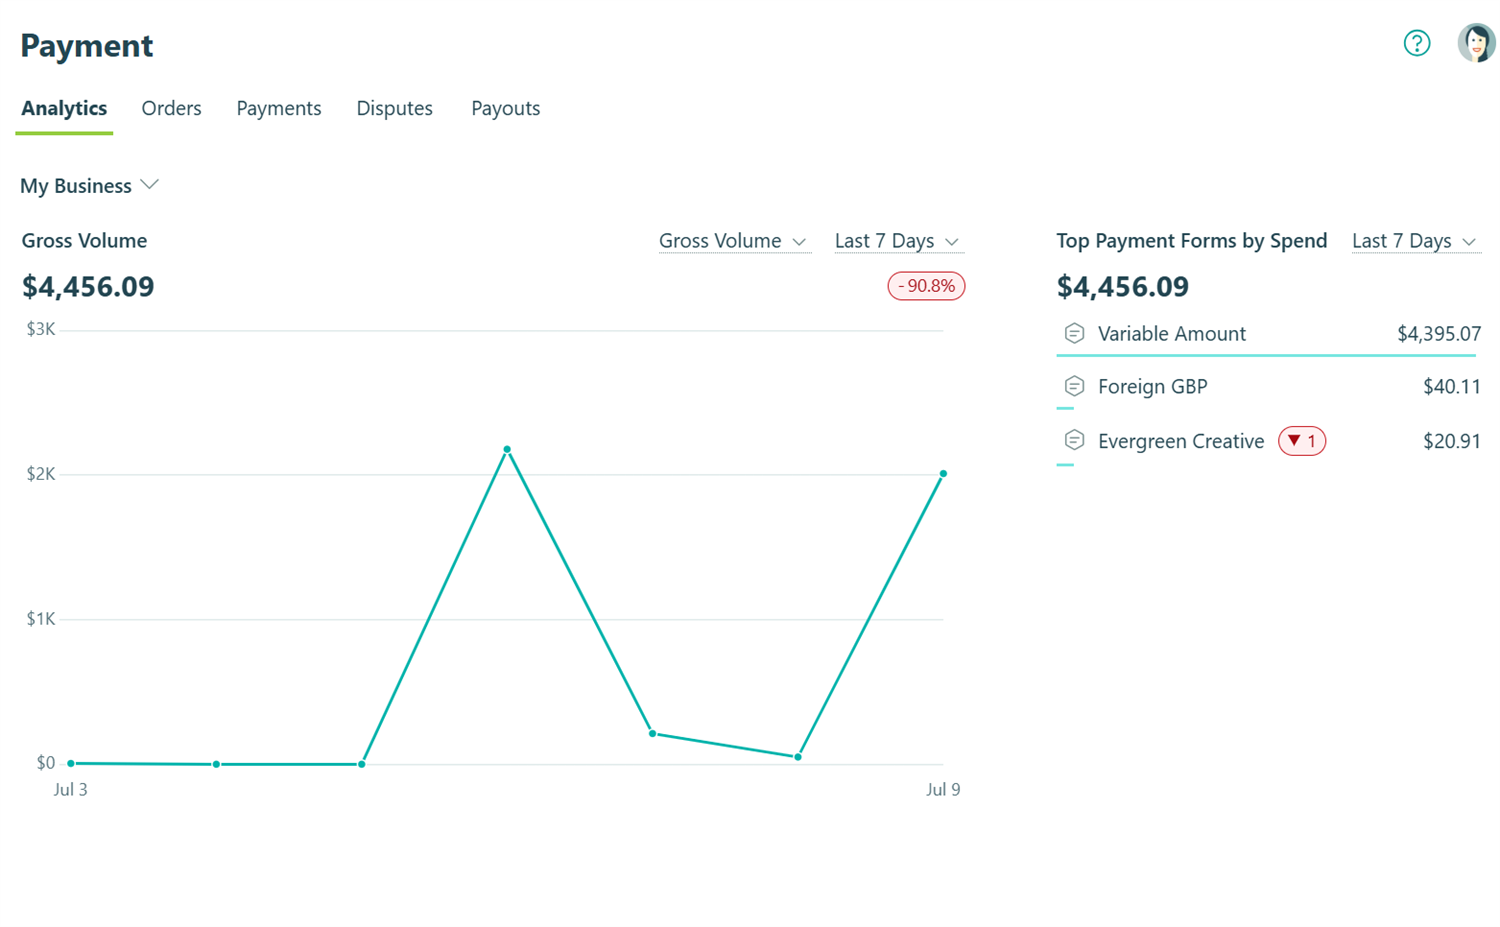
The Analytics page gives you a visual overview of payment activity across your organization. Use it to track payment volume, monitor customer spend, review payment status trends, and stay on top of potential issues with decline and dispute rate alerts.
If your organization has multiple Cognito Pay accounts, use the account switcher to move between them. Analytics data is computed when the page loads and is not updated in real time.
Time Span Selection
Each chart has its own time span selector, so you can view different charts over different periods independently. Selecting a time span on one chart does not affect any other chart.
Available time spans are:
- Last 7 Days – The past 7 days ending with today.
- Last 30 Days – The past 30 days ending with today.
- YTD – January 1 of the current year through today.
- {Previous Year} – The full prior calendar year.
- All Time – All available payment data with no time filter.
Your time span selection for each chart is saved and restored the next time you visit the page.
Comparing to a Previous Period
Most charts display a percentage change indicator comparing the selected time span to the equivalent preceding period. For example, Last 30 Days compares against the 30 days before that. YTD compares against the same date range in the previous year. All Time does not include a comparison.
When the previous comparison period is only partially available, the comparison is based on whatever data exists and a tooltip on the change indicator discloses the partial comparison.
Charts
Volume
The Volume chart shows payment volume over time. Use it to track how much money is moving through your forms and spot trends in revenue.
You can toggle between Gross Volume and Net Volume:
- Gross Volume – The total amount received from successful payments, including funds later refunded, reversed, or disputed.
- Net Volume – Gross volume minus processing fees, refunded payments, reversed payments, and active dispute amounts.
The chart summary displays total volume for the selected time span and the percentage change versus the previous period.
Top Payment Forms by Spend
This bar chart shows the top 10 forms by gross volume for the selected time span. Forms are ranked from highest to lowest spend. Each row includes the form name, spend amount, a reference bar proportional to its share of the total, and a rank change indicator when the form’s rank has changed versus the previous period.
Clicking a form row opens the Entries page for that form.
Top Customers by Spend
This bar chart shows the top 10 customers by gross volume for the selected time span. Customers are ranked from highest to lowest spend. Each row includes the customer name, spend amount, a reference bar, and a rank change indicator when the customer’s rank has changed versus the previous period.
Clicking a customer row opens the customer profile.
Average Spend Per Customer
The Average Spend Per Customer chart shows the average gross payment amount per customer over time. The chart plots two lines – one for identified customers associated with a payment, and one for unidentified payments with no customer attached. The two lines are color-coded and labeled in the chart legend.
The chart summary displays total gross volume divided by the total number of identified customers for the selected time span, along with the percentage change versus the previous period.
Payment Status Breakdown
This chart shows the distribution of payments by status for the selected time span. Each row displays the status name, its percentage of total payments, and a reference bar. The chart summary shows the percentage of payments with a Succeeded status and a stacked bar showing the full distribution across all statuses.
The Payment Status Breakdown does not include rank change indicators.
Alerts
Cognito Pay monitors your payment activity and sends alerts when certain conditions are met. Alerts are delivered as an in-app notification banner at the top of the Analytics page and by email to organization owners and admins.
Two alert types are available:
| Alert | Trigger |
|---|---|
| Payment Decline Rate | At least 20% of payments have declined and at least 5 payments have declined in the past 5 minutes. |
| Dispute Rate | At least 0.9% of payments have been disputed and at least 5 disputed payments exist in the past 30 days. |
The in-app notification remains visible until the alert condition is no longer true. Alert emails are not repeated while the same condition remains active – a new email is only sent if the condition clears and then triggers again.